Reports
1. What do I see on the homescreen of the reports module?
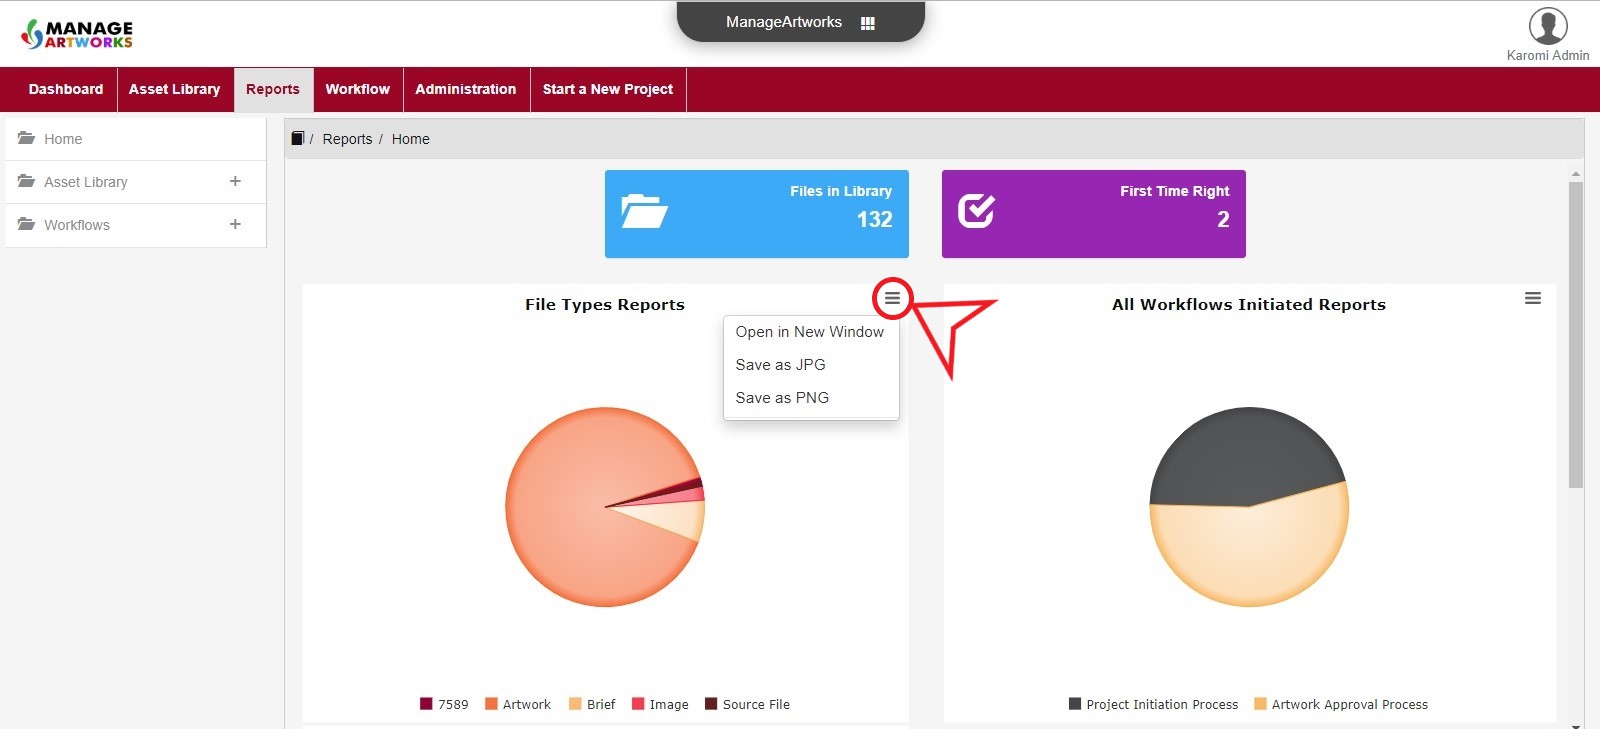
Home screen of the Reports module has data represented in tiles as well as charts.
The tiles available are:
- Files in Library – displays the count of files in the Asset Library
- First Time Right – displays the count of the projects that were reviewed, approved and the artwork released without any rework or rejection
The Pie Charts, downloadable as JPEG and PNG, depict data such as File Types, All Workflows Initiated, Average Time Taken and Workflow Status.
For more details including screenshots, visit Reports
2. What are the charts that are displayed on the homescreen of the reports module?
Data from the following charts are displayed as charts on the homescreen of the reports module:
- File Types
- All Workflows Initiated
- Average Time Taken
- Workflow Status
For more details including screenshots, visit Reports
3. Can I download these charts?
Yes, you can open each chart in a new browser window or download by clicking Save in JPG or Save in PNG
4. What happens when I click on a chart?
When you click on a chart, corresponding table containing the data used for creating the chart is displayed. For more details including screenshots, visit Reports
5. What are the categories available in the reports module?
The reports are categorized based on data pertaining to Asset Library and Workflow.
Within Asset Library, the following reports are available:
- File Types
- Files in Library
For more details including screenshots, visit Asset Library Reports
Within Workflow, the following reports are available:
- Artwork Approval Reports
- Project Initiation Reports
- First Time Right Reports
- All Workflows Initiated Reports
- All Average Time Taken Reports
- All Workflow Status Reports
For more details including screenshots, visit Workflow Reports
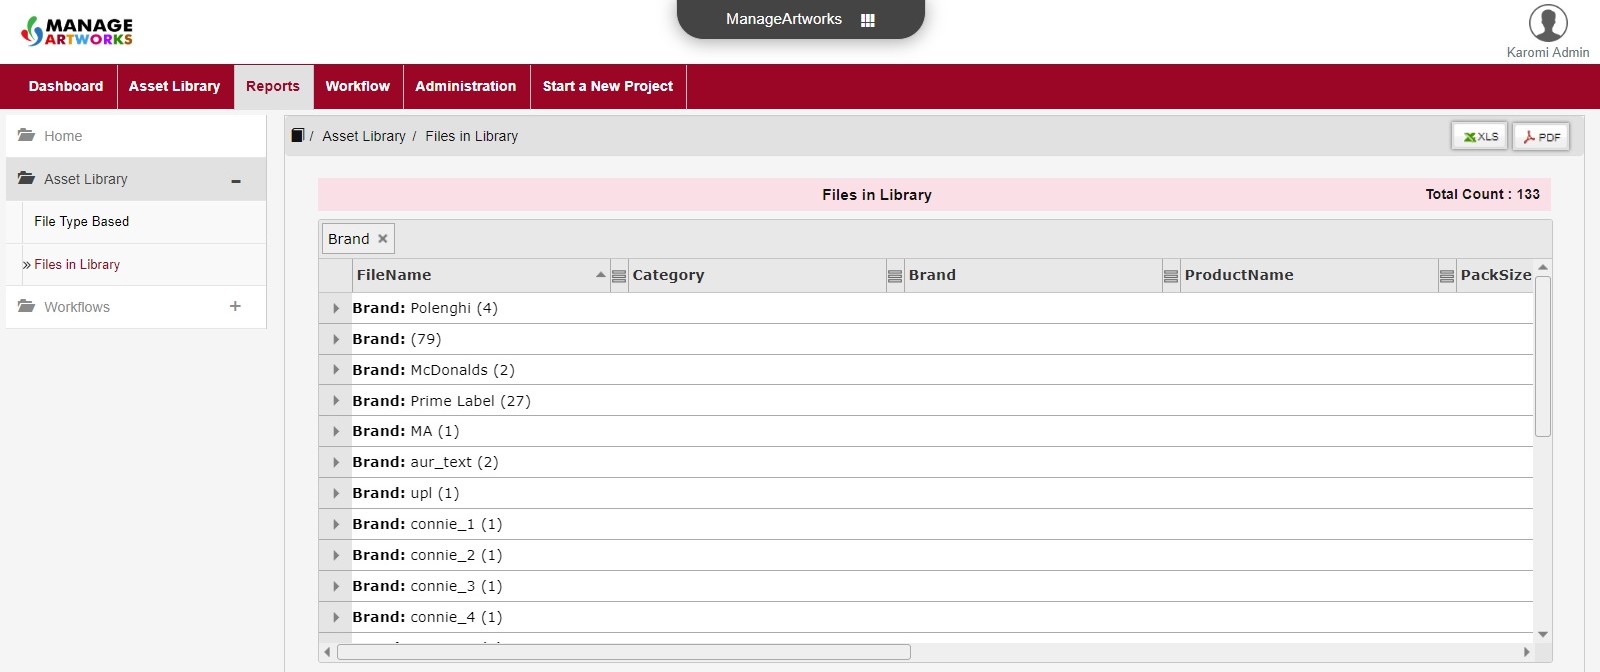
6. Can the columns in a report be sorted or grouped?
Columns in a report can be sorted in ascending or descending order.
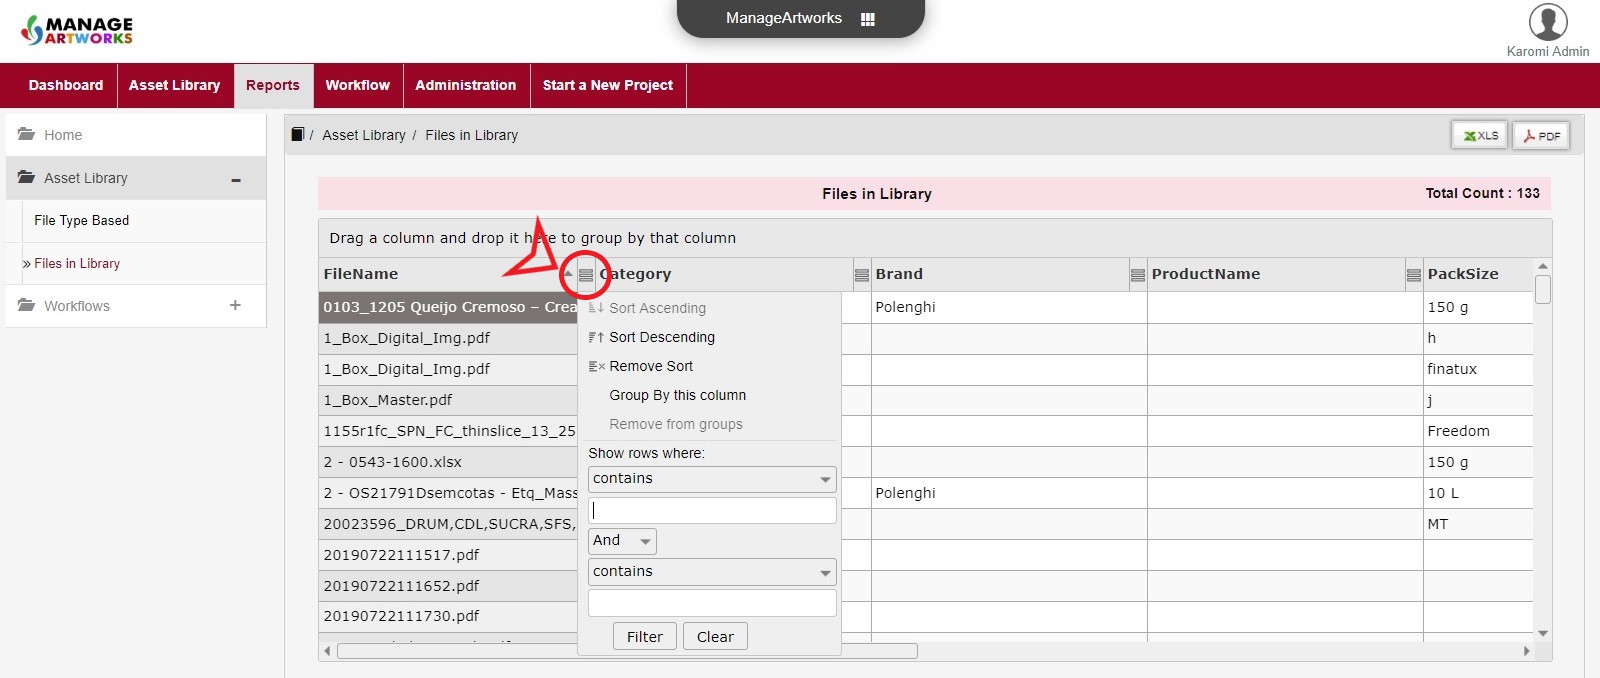
You can also group by column.
Use filter to display rows based on values in a cell.
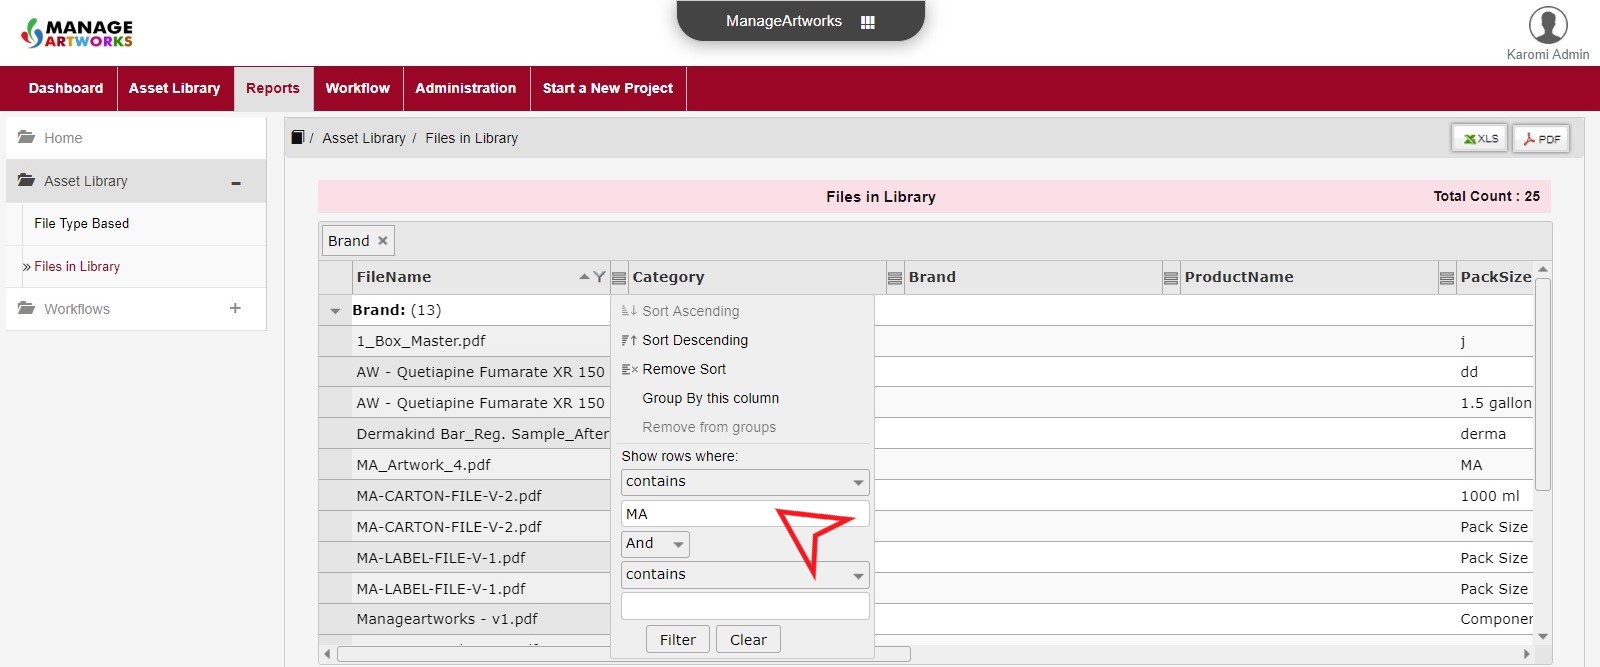
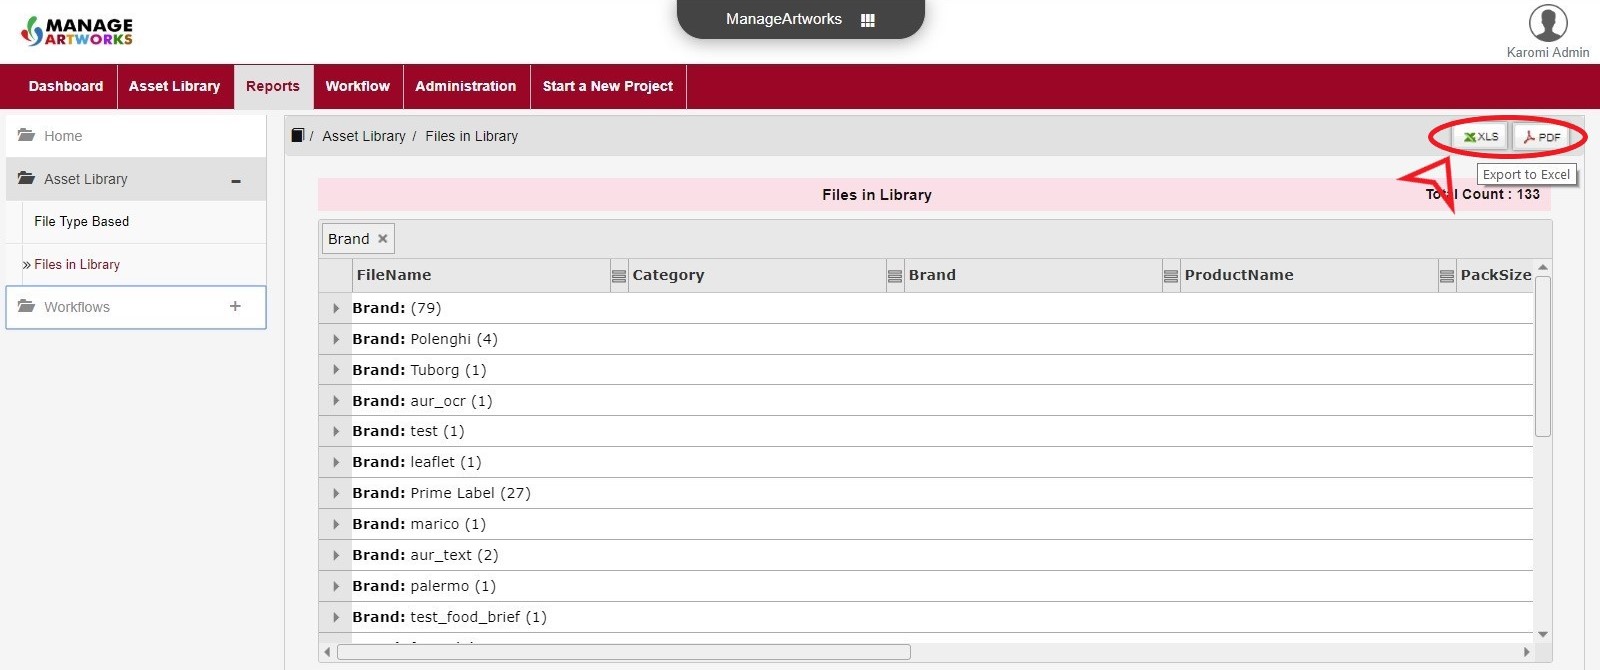
7. Are the reports downloadable?
Absolutely. You can export reports as spreadsheet (.XLS format) or as a PDF document.