Image Comparison
Image Compare tool which is available in the sidebar of Viewer, performs a pixel to pixel comparison between two PDF files.
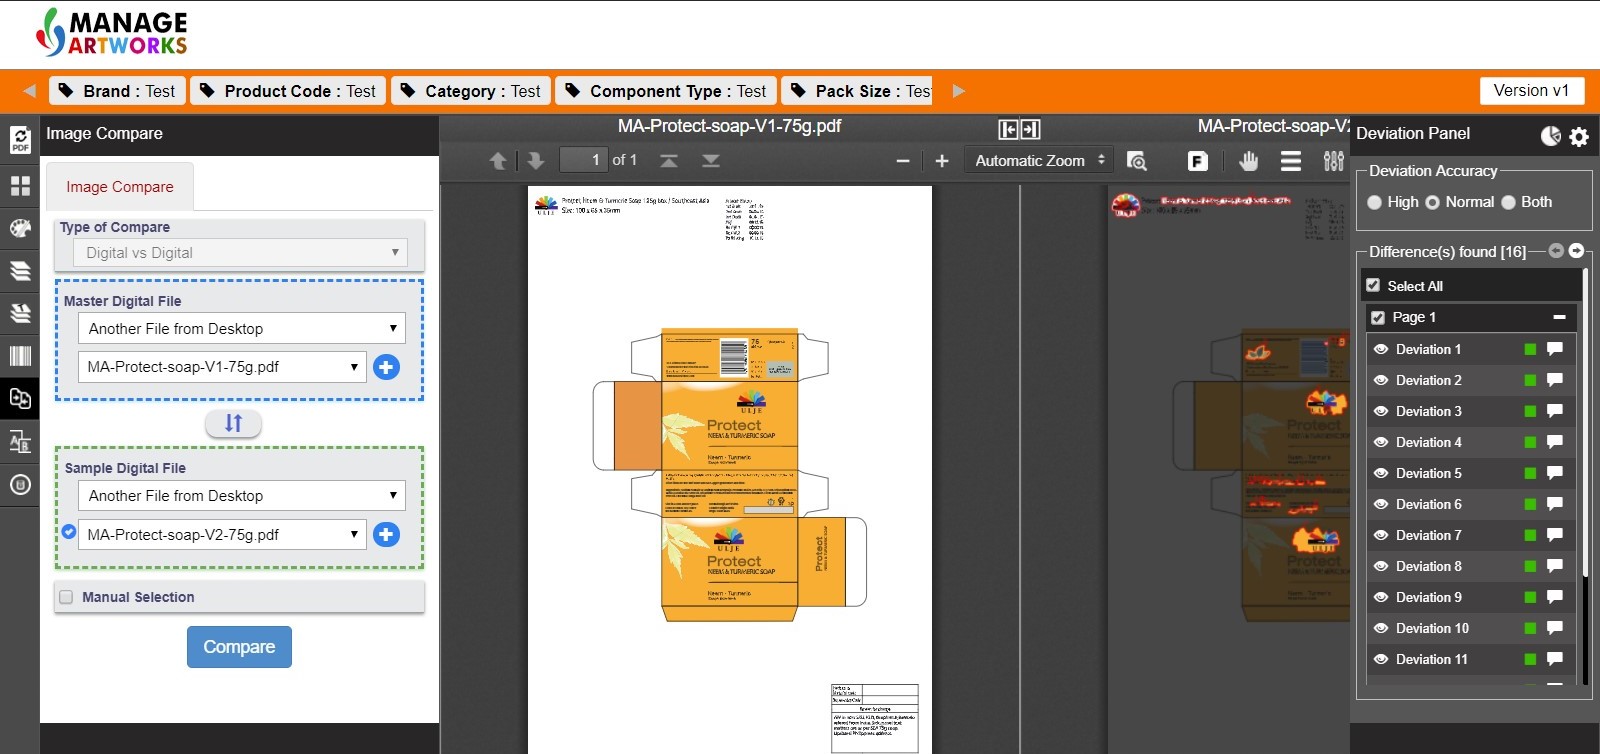 The source file is referred to as Master Digital File and the target file is referred to as Sample Digital File. If the user launches viewer from a workflow or asset library, then that file becomes the Master Digital File. The files can be:
- Another version of the file
- Another file in library
- Another file from desktop Note:
- The Master and Sample files can be interchanged with each other by clicking on swap option.
- When Manual Selection is enabled, the user can select regions in the Master and Sample files for restricting comparison only between the selected regions.
After selecting the master and sample files, the user clicks Compare to generate results.
There are two modes of comparison: Flicker (default mode) and Side By Side. Flicker mode refers to the master and sample getting superimposed over each other in rapid succession which enables the user to spot the differences in the files. This is the default mode for displaying the files after comparison. There is a Toggle to Diff Mode button on the toolbar that allows the user to switch between modes.
The image on the left is the Master File and the image on the right is the Sample File on which the differentials are drawn. The Title Bar displays the titles of the Master and Sample Files and has a collapsible section to have a full page view of either the Master or the Sample File.
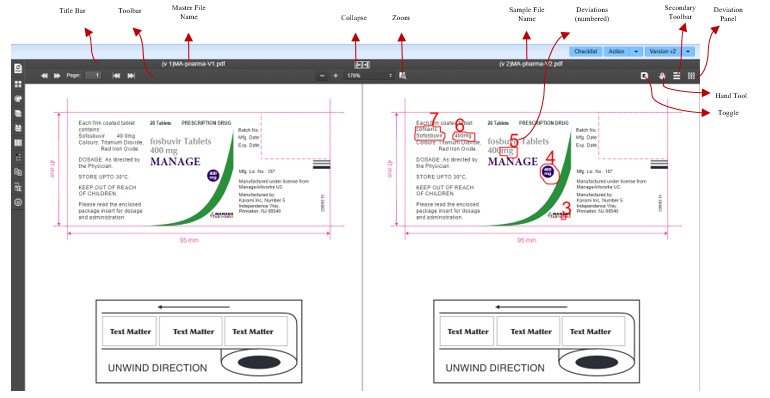 The Image Comparison Toolbar is common for both Master and Sample Files where options to navigate pages, adjust size, zoom are available to the user. The files can be rendered in actual size or zoomed. The minimum zoom is 25% and the maximum is 400%. Area Zoom is available to zoom a particular section of the file. The same section in the master will get zoomed automatically. Hand Tool is used to give the user flexibility on using his move to move the images. Note: the corresponding movement is replicated in the master file as well.
In Side by Side Mode, the Secondary Toolbar is used for enabling rotation (clockwise and anticlockwise). In Flicker Mode, additional buttons are available to let the user Pause the flicker and adjust flickering speed – slow (500ms), medium (1000ms) and fast (1500ms).
Deviation Panel
The header section in this panel comprises of two icons: Report and Setting/Style icons. Report is used to generate a report in PDF which will download automatically. The setting/style icon allows the user to let the system mark differences either as a Contour or as a Box. Deviation Colour can also be defined. User can also turn off deviation number. Deviation Accuracy allows the user to select the level of accuracy from a choice of High, Normal and Both. There will be difference in the number of deviations shown when the user selects one of the above three options. For example: the number of deviations will be the highest when the accuracy is set as high and lowest if set as low. Differences Found(n): ‘n’ refers to the number of deviations. The left and right navigation buttons beside the number will help the user move from one deviation to the next or previous.
In this section, the numbered deviations are listed in the ascending order. The eye icon preceding the Deviation lets the user turn the box/contour on or off. The deviations listed are hyperlinked. The user clicking Deviation 1 will be taken to that section of the file with appropriate zoom to focus the attention of the user on the deviation. In the Deviation Panel, all deviations are listed by default de-pending on the accuracy level set by the user. If a particular deviation need to be ignored, the user can click the Green Box following the numbered deviation to do so. Additionally, the user can enter comments as well. If the user is willing to accept the deviation but has a comment to add, they can click comment icon next to the green box.
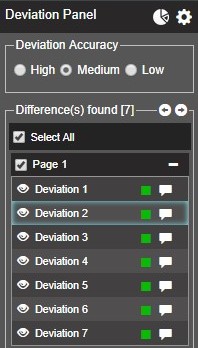
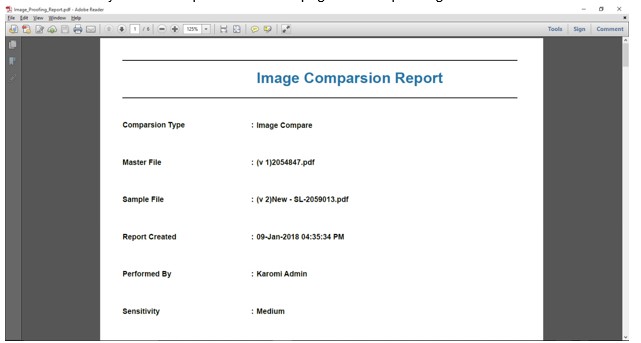
Image Comparison Report
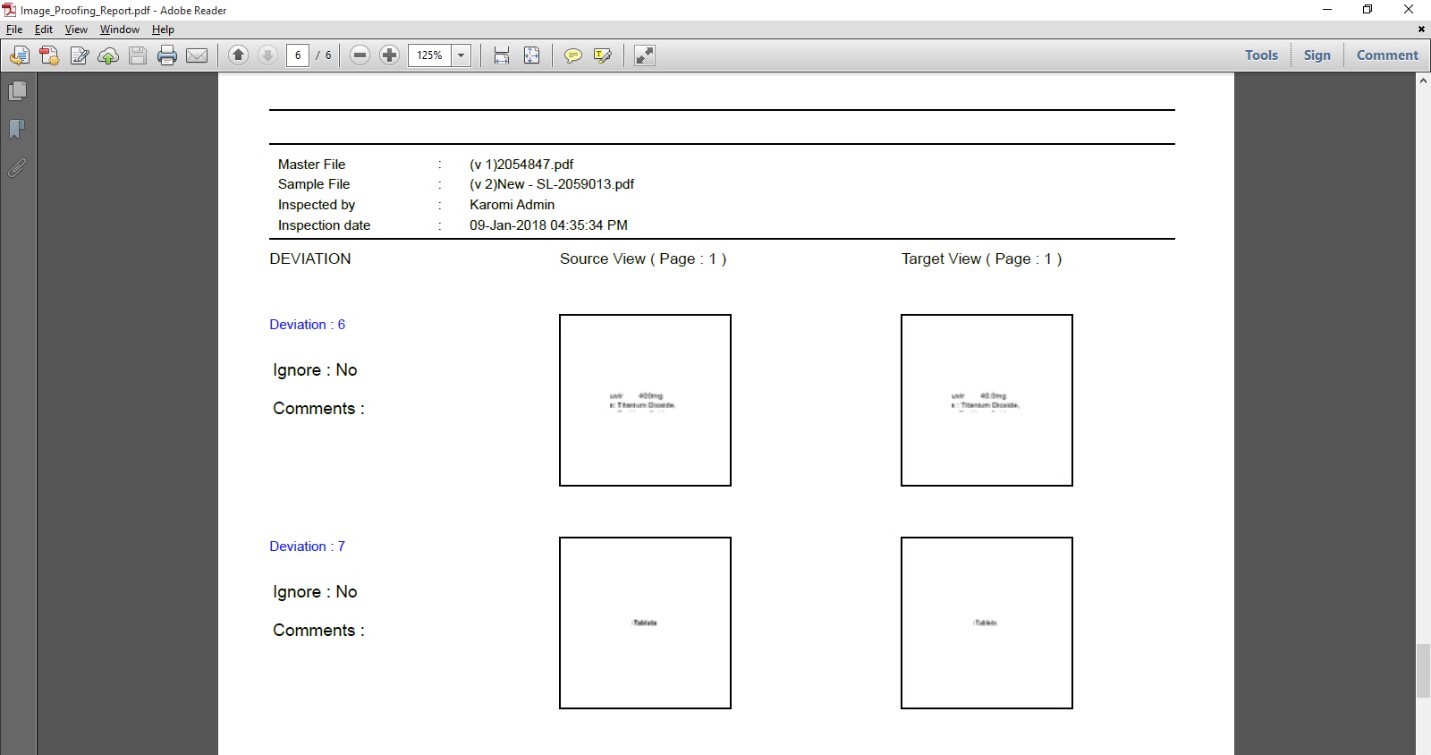
When the user clicks on the report icon, a PDF report is generated and automatically downloaded onto the client system. A snapshot of the first page of the report is given below:
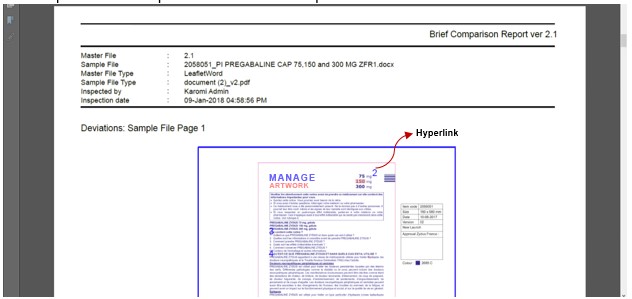 Each number beside the box or contour in a deviation acts as a hyperlink to the deviation listed in the subsequent pages where the master and sample view is displayed side by side along with whether the user has chosen to ignore the deviation or not and any comments added to that deviation. The numbered deviations on these pages are also hyperlinked to lead the user back to the differences page.